Building your own Django Debug Toolbar panel
Django Debug Toolbar (hereafter 'DjDT') should hopefully need no introduction to anyone working with Django. It earns its place as an invaluable tool in the belt, making building and especially debugging Django projects a whole lot easier.
A DjDT toolbar is just a collection of pluggable 'panels'. Each panel is responsible for its own data collection and display. DjDT comes with a collection of in-built panels (Request, SQL, Templates, etc), but it is at least hypothetically possible to plug in panels from elsewhere.
Despite this, I've always treated DjDT as a black box. In my experience, the codebases for these sorts of instrumentation / introspection tools can look quite gnarly, because instrumentation can be really hard!
The stars recently aligned when I found myself troubleshooting a 'feature flags' mechanism we were building for my jobby-job Django project. I wanted to be able to load a page in my browser and know which feature flags were evaluated, what the results were, and which code triggered each evaluation. DjDT's in-built panels—obviously not knowing the first thing about the code I'd just written—did not really surface this information, and the mental overhead of sifting through noisy logger output was becoming too cumbersome. I had means, motive, and opportunity.
I looked into what's involved in building a DjDT panel fully expecting to put it in the too hard basket. The barrier to entry ended up being lower than I'd imagined. I found the documentation a bit lacking though. I'm writing this post in part to solidify my understanding enough to put in a PR with some suggested improvements.
# Why would anyone want to do this?
You'll know it when you see it. DjDT's in-built panels tend to focus on giving you a window into the internal processes—database queries, Django template renderings, etc—that occurred 'in the context of' a given HTTP request. Maybe you want more visibility into the Elasticsearch queries, or LLM requests, or whatever else, that occurred in the context of your request. Hell...those are a couple of great ideas for open-source third-party DjDT panels!
# How do you do it?
In this post, let's stick with the feature flags example.
Whilst feature flags are completely orthogonal to DjDT panels, you may find it harder to follow this example without at least a surface-level understanding of the concept. Wikipedia says:
A feature toggle in software development provides an alternative to maintaining multiple feature branches in source code. A condition within the code enables or disables a feature during runtime. In agile settings the toggle is used in production, to switch on the feature on demand, for some or all the users. Thus, feature toggles do make it easier to release often. Advanced roll out strategies such as canary roll out and A/B testing are easier to handle.
Which I think is about all you need to know.
So, say you have a function like this:
def feature_enabled(name: str) -> bool:
    """Is the given feature flag enabled?

    Arguments:
        name: The name of the feature flag to check.

    Returns: Whether the feature is on or off.
    """

    # ...

    return result
Here's how you might use this function throughout your project:
from ..feature_flags.utils import feature_enabled
from django.shortcuts import render

def school_dashboard(request):
    """Landing page for a school."""

    if feature_enabled('redesigned-dashboard'):
        # Show the redesigned dashboard
        template_name = "new_school_dashboard.html"
    else:
        # Show the old dashboard
        template_name = "old_school_dashboard.html"

    return render(request, template_name)
In complex, mature codebases, code that's dealing with feature flags is sometimes not this easy to reason with. Often your feature_enabled() takes in some additional context, like the current user, which it uses to make its decision. You can easily find yourself asking, "why is this flag evaluating True earlier in the request, but False later in the request?", "Why is the same flag being evaluated multiple times in the first place?", "Which code is actually triggering the evaluation?" All questions that sound very similar to ones that I'd often reach for DjDT to answer.
# Creating an empty panel
Each DjDT panel is represented by a subclass of debug_toolbar.panels.Panel, so let's make one for our panel. You can put this anywhere in your codebase.
from debug_toolbar.panels import Panel

class FeatureFlagsPanel(Panel):
    title = "Feature Flags"
    template = "feature_flags_panel.html"
Create a very minimal template file:
<!-- Silence is golden... -->
Then, tell DjDT about the panel by adding it to the DEBUG_TOOLBAR_PANELS Django setting.
DEBUG_TOOLBAR_PANELS = [
    # ...

    # Full Python module path to your panel class
    "panels.FeatureFlagsPanel",

    # ...
]
DEBUG_TOOLBAR_PANELS doesn't extend the default panels, it replaces them. If you define DEBUG_TOOLBAR_PANELS, you need to re-include any default panels that you want to keep using. The DjDT documentation has a handy list that you can just paste in.
Load up a page in your browser, open DjDT, and there's an entry for our new panel! Clicking on the panel opens our blank canvas.
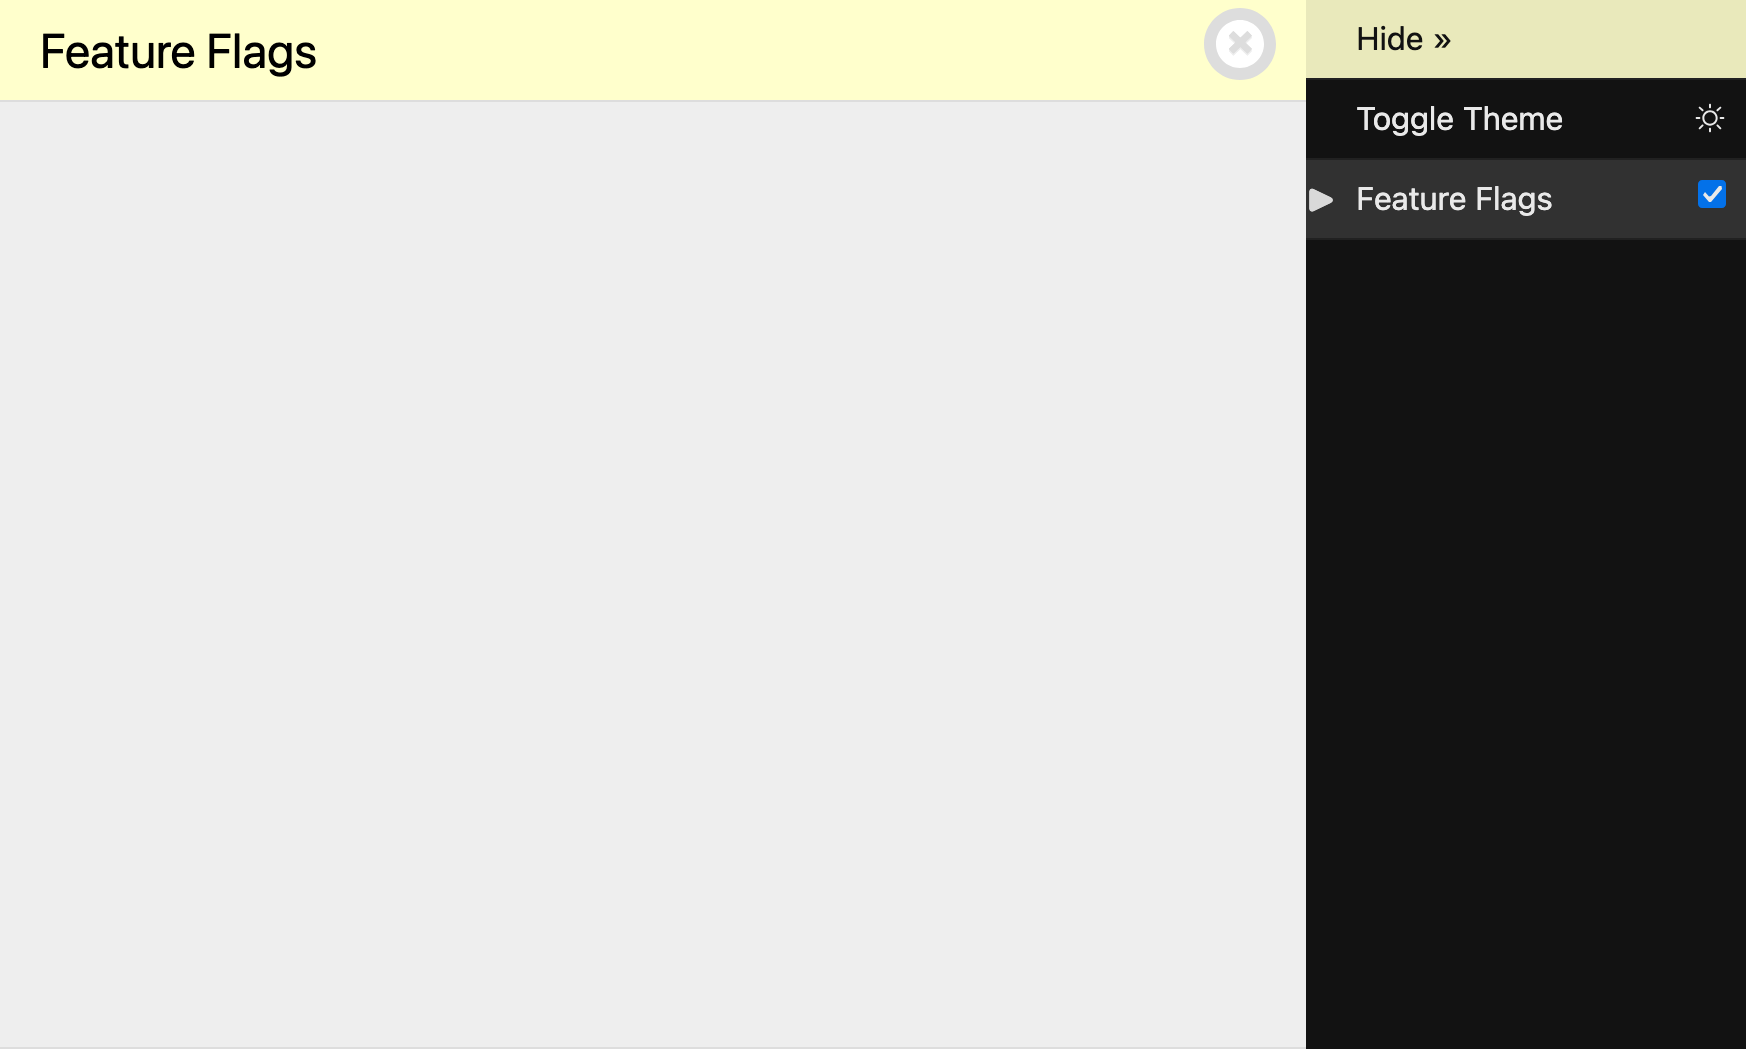
Our blank DjDT panel.
A good start, but not very useful. Let's build it out.
# Instrumenting
The DjDT panels API gives us a few 'hooks' where we can implement our panel's functionality.
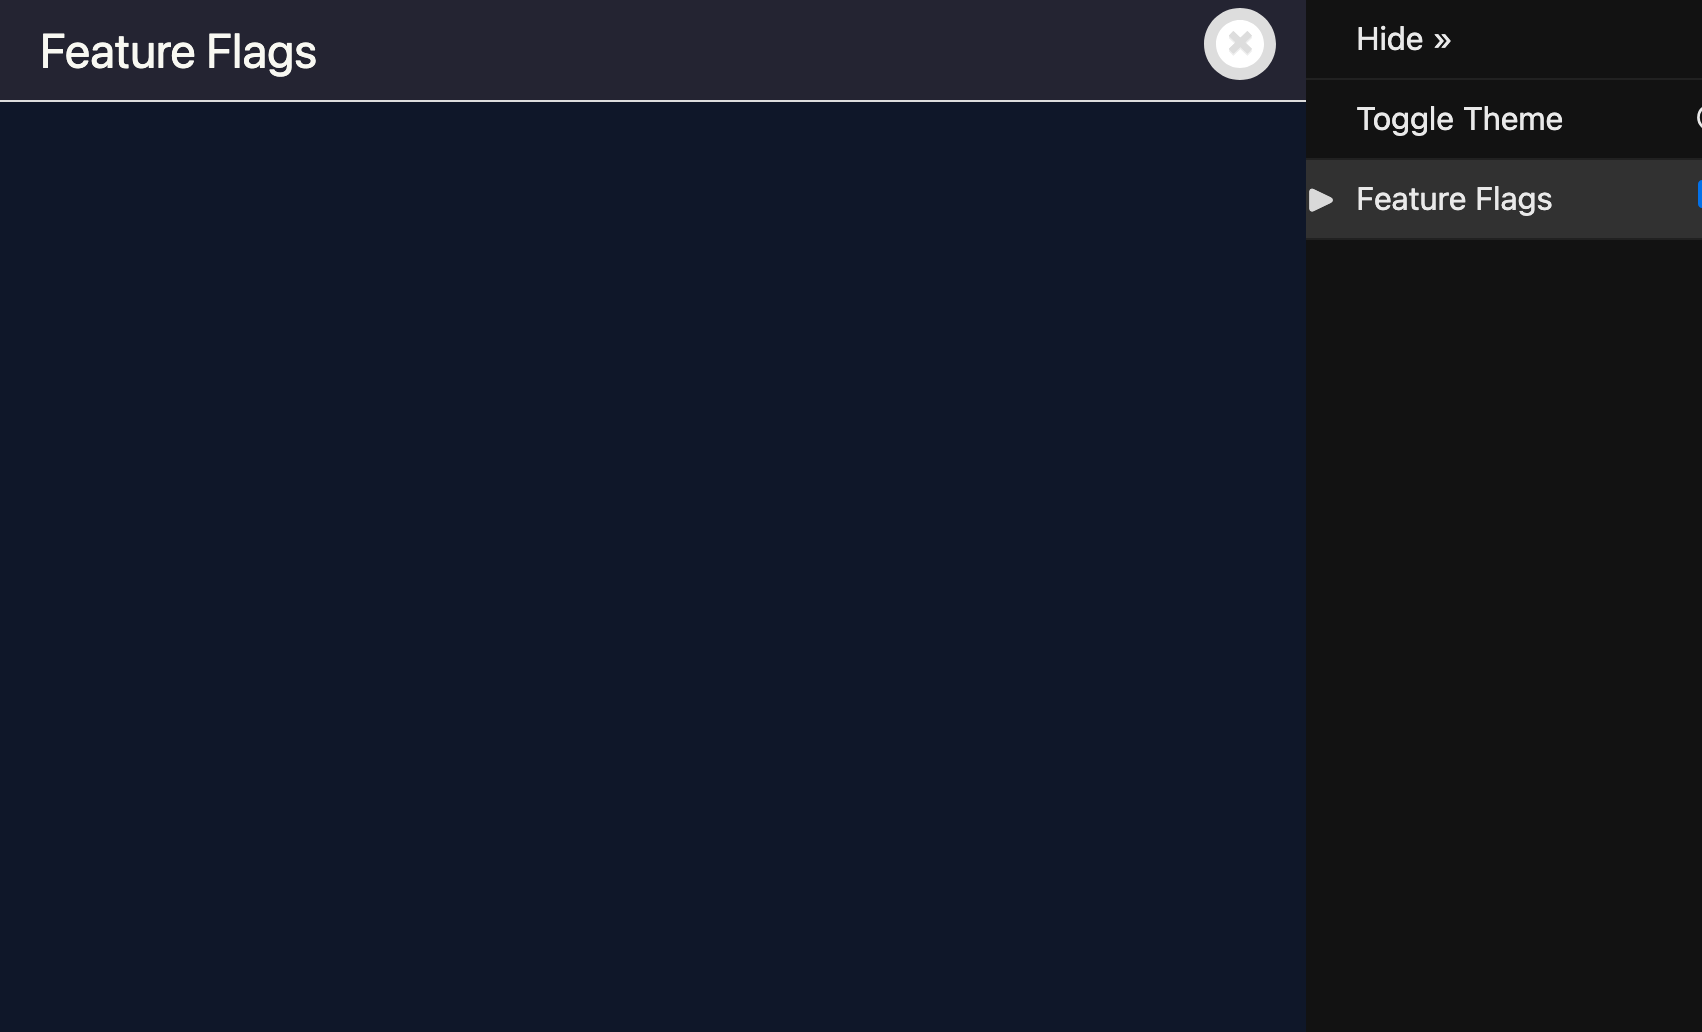
DjDT runs enable_instrumentation() as soon as it's able (i.e., when the DjDT middleware runs), and only if your panel has been 'enabled'. If you untick the checkbox next to 'Feature Flags' in your panel interface, it will not run. We can use this as an opportunity to perform any initial panel setup. It's called enable_instrumentation() because DjDT panels tend to need to 'instrument' code. Again, looking to Wikipedia:
In computer programming, instrumentation is the act of modifying software so that analysis can be performed on it.
What we actually do here depends entirely on what our goals are, so let's firm up what we want our feature flags panel to do:
- Show a list of feature flag 'evaluation events', i.e. calls to
feature_enabled(). - For each evaluation event, show:
- The feature flag that was evaluated.
- The result of the feature flag evaluation, i.e. should the feature be turned on or off?
- What triggered the evaluation, i.e. the stack trace for the
feature_enabled()call.
There are a lot of deciding factors that go into how we get this information. The code that you want to instrument, and the context / information that you want to surface, could be first-party code that you control, or third-party code that you don't. The code could be third-party, but it could provide a nice 'events' or 'hooks' interface that allows you to ask for code to be called when certain events happen within the third-party code, or it could not.
In our example, we're let off pretty easy, in that feature_enabled() is first-party code that lives in our codebase, so we won't have to resort to harder and riskier means of instrumentation.
But still, how do we instrument feature_enabled()? We could embark upon building our own events / hooks / callbacks mechanism, or maybe even a globally-accessible evaluation event store that our panel can access. Alternatively, we can make use of one of the many Django batteries that make our lives easier, the 'signals' framework.
Django's signals framework allows us to:
- Define 'signals', which are best thought of as 'event types' (e.g., "user logged in", "password reset", or indeed "feature flag evaluated").
- 'Send' these signals from anywhere in our codebase, optionally including any additional information / context.
- Register code to be called in the event of a particular signal being sent, by doing what Django calls 'connecting' a 'receiver'.
This is perfect for our situation. It provides a means by which:
feature_enabled()can say, "if anyone cares, I've just finished evaluating a feature flag, and here's some information about what happened", andFeatureFlagsPanelpanel can say, "hey, I care about feature flag evaluations, tell me!"
Even better, we can do this all in a way where feature_enabled() and FeatureFlagsPanel are still loosely coupled.
FeatureFlagsPanelis not strictly concerned withfeature_enabled()itself. We could completely throw away and re-implement feature flag evaluations, and as long as the new implementation sent out the same signal, containing the same information,FeatureFlagsPanelis still happy.feature_enabled()doesn't know about the existence ofFeatureFlagsPanelat all, and doesn't really care about its existence. Its end of the bargain is simply to signal any feature flag evaluations taking place, providing information about the evaluation in a certain format.
Let's start small, and simply send a signal reporting that a feature flag evaluation has occurred, without worrying about providing any additional information about the evaluation itself.
First, we create our feature_flag_evaluated signal, which is as simple as instantiating django.dispatch.Signal.
from django.dispatch import Signal

feature_flag_evaluated = Signal()
You can do this anywhere, but I'd suggest creating a separate signals.py file (within the relevant Django-app, if appropriate).
Then, update feature_enabled() to send the signal after every evaluation.
from . import signals

def feature_enabled(name: str) -> bool:
    # Placeholder. In reality, we'd be doing something more complex here.
    result = True

    # We have our evaluation result, send a signal.
    signals.feature_flag_evaluated.send(sender=feature_enabled)

    return result
What is sender?
Django requires that you provide a sender argument to Signal.send(), even if it's None. This tells Django what's responsible for sending the signal. As well as being passed through to any receivers as a keyword argument, you can opt to have your receiver only receive signals from a specific sender using Signal.connect(sender=...). None of this is really relevant or useful for our use-case, so we can just set sender=feature_enabled as it's as good an attribution as any.
Back in FeatureFlagsPanel, let's listen for our new signal:
from debug_toolbar.panels import Panel
from .feature_flags import signals

class FeatureFlagsPanel(Panel):
    title = "Feature Flags"
    template = "feature_flags_panel.html"

    def enable_instrumentation(self):
        # Connect to the evaluation signal.
        signals.feature_flag_evaluated.connect(self._record)

    def disable_instrumentation(self):
        # Disconnect from the evaluation signal.
        signals.feature_flag_evaluated.disconnect(self._record)

    def _record(self, sender, **kwargs):
        # Runs whenever the signal is called.
        print("Feature flag evaluated!")
We've:
- Imported our new
feature_flag_evaluatedsignal. - Added a new method,
_record(), which—as the name indicates—simply prints a message when called. - In
enable_instrumentation, connected our new signal with_record(). Wheneverfeature_flag_evaluatedis sent,_record()will be called. - In
disable_instrumentation, disconnected our receiver. This is DjDT's indication that we don't need to measure anything, so there's no point in listening anymore.
Easy!
To be clear, _record() being a method on our Panel subclass does not imply any magical connection between DjDT and Django's signals framework. A signal receiver can be any callable you want. Later on, when we get to actually recording evaluation events, our receiver will need to have access to our Panel's internal state.
_record() accepts sender and **kwargs per Django's direction on writing receiver functions:
... the function takes a
senderargument, along with wildcard keyword arguments (**kwargs); all signal handlers must take these arguments.
To ensure that everything is working, we can call feature_enabled() within a request:
from ..feature_flags.utils import feature_enabled
from django.shortcuts import render

def my_view(request):
    return render(
        request=request,
        template_name="my_view.html",
        context={
            "feature_a_enabled": feature_enabled('feature-a'),
            "feature_b_enabled": feature_enabled('feature-b'),
            "feature_c_enabled": feature_enabled('feature-c'),
        },
    )
Sure enough, looking at our runserver output:
Feature flag evaluated!
Feature flag evaluated!
Feature flag evaluated!
[01/Jan/2026 00:00:00] "GET /my-view/ HTTP/1.1" 200 5216
Great!
# Recording evaluations
It's not that much harder to start doing something useful:
from debug_toolbar.panels import Panel
from .feature_flags import signals

class FeatureFlagsPanel(Panel):
    title = "Feature Flags"
    template = "feature_flags_panel.html"

    def __init__(self, *args, **kwargs):
        # Empty list to store evaluation info.
        self.evaluations: list[dict] = []
        super().__init__(*args, **kwargs)

    def enable_instrumentation(self):
        # Connect to the evaluation signal.
        signals.feature_flag_evaluated.connect(self._record)

    def disable_instrumentation(self):
        # Disconnect from the evaluation signal.
        signals.feature_flag_evaluated.disconnect(self._record)

    def _record(self, sender, **kwargs):
        # Record feature flag evaluations.
        self.evaluations.append(kwargs)

    def generate_stats(self, request, response):
        # Pass the recorded evaluations to the template.
        self.record_stats({"evaluations": self.evaluations})
Breaking this down:
- We create a new list—
evaluations—to store information about each captured evaluation. - When a signal is sent, we add a new item to
evaluations—a dict containing the keyword arguments provided as part of the signal call. - When all is said and done, we send
evaluationsinto DjDT's internal 'stats storage', which makes it available to our template.
This is a little confusing. What's generate_stats()? And why does it call record_stats() instead of just returning?
generate_stats() is another DjDT hook. It can serve a number of purposes depending on your use-case. DjDT calls it 'on the way out' of the middleware stack, i.e. when the view, and all inner middleware, have finished processing the request and preparing the response. DjDT gives generate_stats() access to the request and response objects, so if your custom panel needs to do anything with those, here's a place to do it! In our case, however, generate_stats() is a place for us to perform any necessary post-processing of our 'raw' measurement data. With our current example as simple as it is, there's not really anything for us to do here.
record_stats()'s existence is a little more perplexing to me. Digging around the codebase I get the impression that DjDT is somewhat in flux at the time of writing. There looks to be some effort involving pluggable backends for storing panel data. At the end of the day, you need to pass your data through this function in order to get it to your template.
Speaking of templates, let's get our data on the page!
{% if evaluations %}
<table>
  <thead>
    <tr>
      <th>Evaluation</th>
    </tr>
  </thead>
  <tbody>
    {% for evaluation in evaluations %}
    <tr>
      <td>
        <pre>{{ evaluation|pprint }}</pre>
      </td>
    </tr>
    {% endfor %}
  </tbody>
</table>
{% else %}
<p>No feature flag evaluations recorded.</p>
{% endif %}
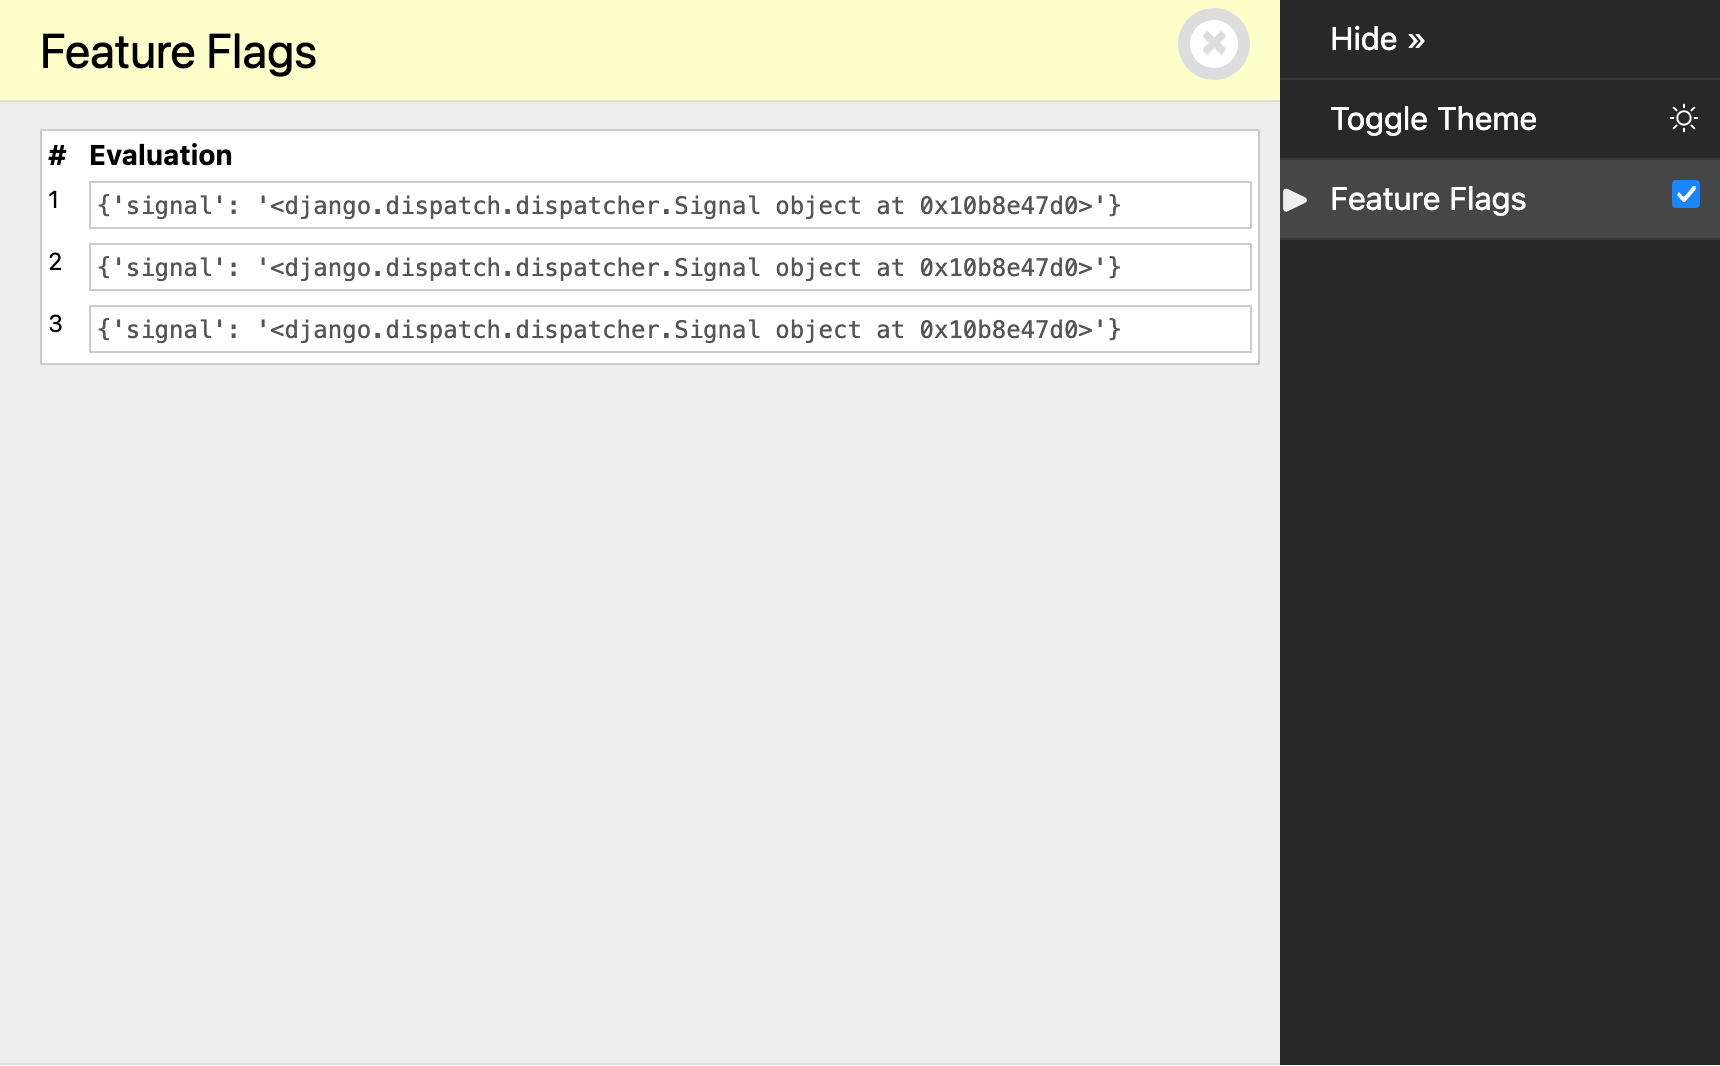
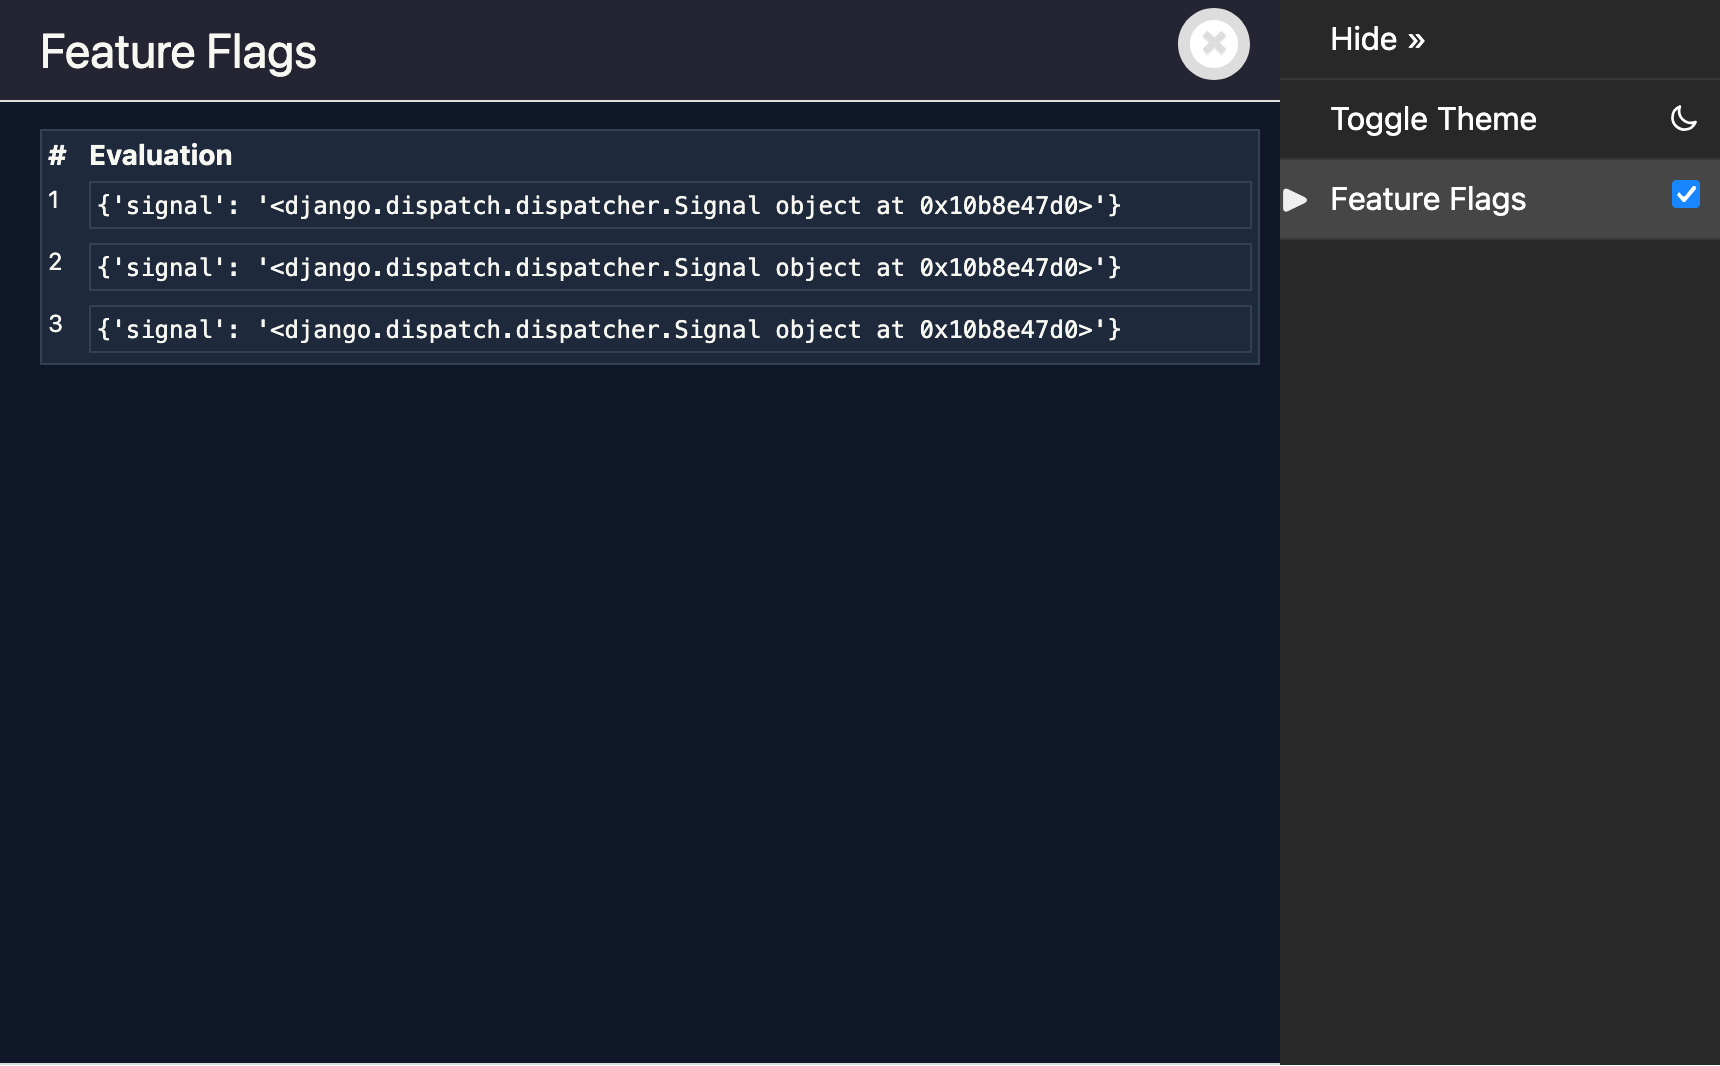
Reload our page, and we've got a table of evaluations!
# Sending context with signals
We still aren't actually getting information about the evaluations themselves. This is as simple as sending the desired information through from feature_enabled():
from . import signals

def feature_enabled(name: str) -> bool:
    # In reality, we'd be doing something more complex here.
    result = True

    # We have our evaluation result. Send a signal.
    signals.feature_flag_evaluated.send(
        sender=feature_enabled,
        name=name,
        result=result,
    )

    return result
And showing it in our template:
{% if evaluations %}
  <table>
    <thead>
      <tr>
        <th>#</th>
        <th>Name</th>
        <th>Result</th>
      </tr>
    </thead>
    <tbody>
      {% for evaluation in evaluations %}
        <tr>
          <td>{{ forloop.counter }}</td>
          <td><code>{{ evaluation.name }}</code></td>
          <td><code>{{ evaluation.result }}</code></td>
        </tr>
      {% endfor %}
    </tbody>
  </table>
{% else %}
  <p>No feature flag evaluations recorded.</p>
{% endif %}
# Stack traces
That's most of our requirements met, but how do we know which code triggered each evaluation?
Django Debug Toolbar provides a handy set of utilities for capturing and showing stack traces. Whilst undocumented, they're used for showing stack traces in the in-built DjDT panels.
We're going to use these two unfortunately-inconsistently-named functions:
get_stack_trace(), which returns a stack trace that's a bit more 'polished' than what you get straight from the standard librarytracebackmodule.render_stacktrace(), which renders the output ofget_stack_trace()in HTML.
In our panel:
from debug_toolbar.panels import Panel
from .feature_flags import signals
from debug_toolbar.utils import render_stacktrace, get_stack_trace

class FeatureFlagsPanel(Panel):
    title = "Feature Flags"
    template = "feature_flags_panel.html"

    def __init__(self, *args, **kwargs):
        # Empty list to store evaluation info.
        self.evaluations: list[dict] = []
        super().__init__(*args, **kwargs)

    def enable_instrumentation(self):
        # Connect to the evaluation signal.
        signals.feature_flag_evaluated.connect(self._record)

    def disable_instrumentation(self):
        # Disconnect from the evaluation signal.
        signals.feature_flag_evaluated.disconnect(self._record)

    def _record(self, sender, **kwargs):
        # Record feature flag evaluations.
        evaluation = {
            **kwargs,
            # Capture stack trace at time of evaluation.
            "stack_trace": get_stack_trace(skip=3),
        }
        self.evaluations.append(evaluation)

    def generate_stats(self, request, response):
        # Pass the recorded evaluations to the template.
        for evaluation in self.evaluations:
            # Add rendered stack traces to each evaluation.
            rendered = render_stacktrace(evaluation["stack_trace"])
            evaluation["rendered_stack_trace"] = rendered
        self.record_stats({"evaluations": self.evaluations})
We first use get_stack_trace() to get an object describing the current call stack. skip=3 cuts the last three frames off the stack, which are:
feature_enabled()sending thefeature_flag_evaluatedsignal.- Django's internals calling our receiver (
FeatureFlagsPanel._record()). - Of course,
_record()callingget_stack_trace()itself.
generate_stats() then begins to show its usefulness, as it's in here that we take the stack trace and render it to HTML using render_stacktrace(). You might be justifiably thinking that the template itself is an even better place to do this. This is the API that DjDT provides, and this is how DjDT's in-built panels do it. Outside of this toy example, you may choose to wrap render_stacktrace() with a template tag / filter and defer it to template rendering time.
Now, in your template:
{% if evaluations %}
  <table>
    <thead>
      <tr>
        <th>#</th>
        <th>Name</th>
        <th>Result</th>
        <th>Stack trace</th>
      </tr>
    </thead>
    <tbody>
      {% for evaluation in evaluations %}
        <tr>
          <td>{{ forloop.counter }}</td>
          <td><code>{{ evaluation.name }}</code></td>
          <td><code>{{ evaluation.result }}</code></td>
          <td>
            <details>
              <summary>View stack trace</summary>
              <pre>{% spaceless %}
                {{ evaluation.rendered_stack_trace|safe }}
              {% endspaceless %}</pre>
            </details>
          </td>
        </tr>
      {% endfor %}
    </tbody>
  </table>
{% else %}
  <p>No feature flag evaluations recorded.</p>
{% endif %}
Which gives us something like this:
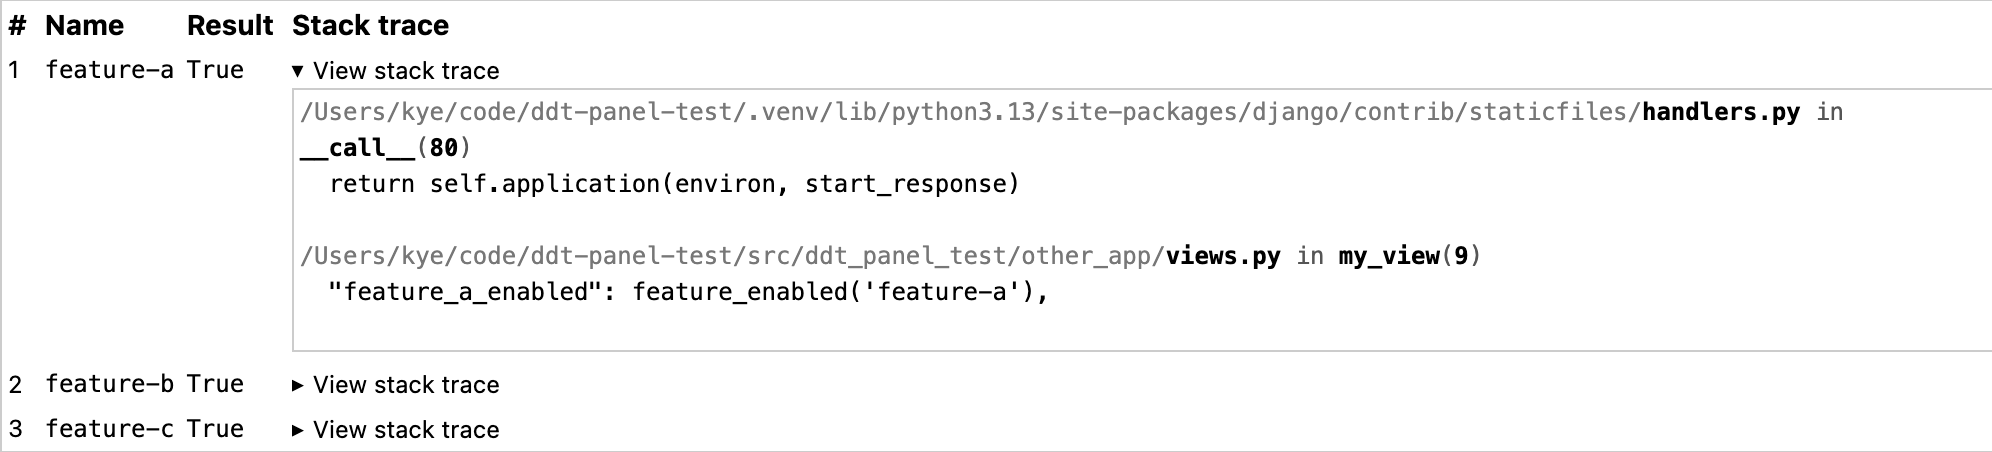
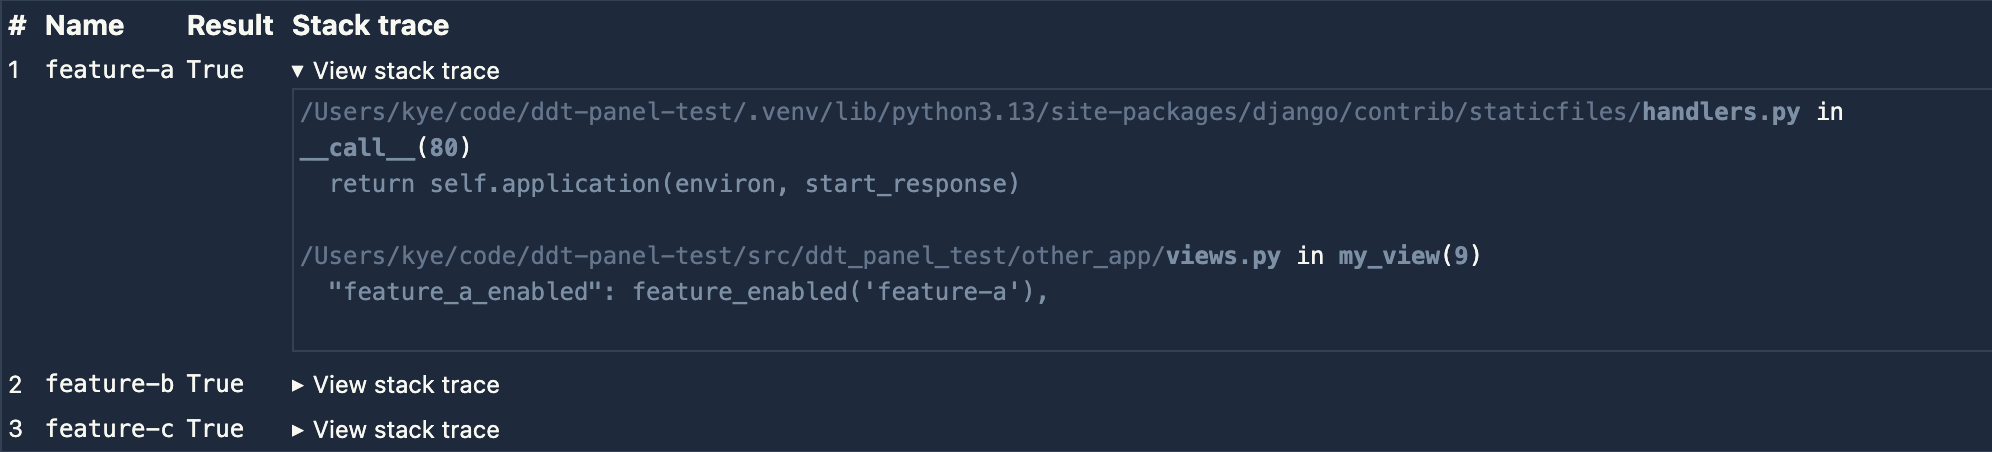
Pretty cool!
# Polishing it up
There's one more thing we can do to polish it up:
from debug_toolbar.panels import Panel
from .feature_flags import signals
from debug_toolbar.utils import render_stacktrace, get_stack_trace

class FeatureFlagsPanel(Panel):
    title = "Feature Flags"
    template = "feature_flags_panel.html"

    def __init__(self, *args, **kwargs):
        # Empty list to store evaluation info.
        self.evaluations: list[dict] = []
        super().__init__(*args, **kwargs)

    @property
    def nav_subtitle(self):
        """Show a summary in the toolbar navigation."""
        count = len(self.evaluations)
        return f"{count} evaluation{'s' if count != 1 else ''}"

    def enable_instrumentation(self):
        # Connect to the evaluation signal.
        signals.feature_flag_evaluated.connect(self._record)

    def disable_instrumentation(self):
        # Disconnect from the evaluation signal.
        signals.feature_flag_evaluated.disconnect(self._record)

    def _record(self, sender, **kwargs):
        # Record feature flag evaluations.
        evaluation = {
            **kwargs,
            "stack_trace": get_stack_trace(skip=3),
        }
        self.evaluations.append(evaluation)

    def generate_stats(self, request, response):
        # Pass the recorded evaluations to the template.
        for evaluation in self.evaluations:
            # Add rendered stack traces to each evaluation.
            rendered = render_stacktrace(evaluation["stack_trace"])
            evaluation["rendered_stack_trace"] = rendered

        self.record_stats({"evaluations": self.evaluations})
Now, we can see the number of flag evaluations without even opening our panel!
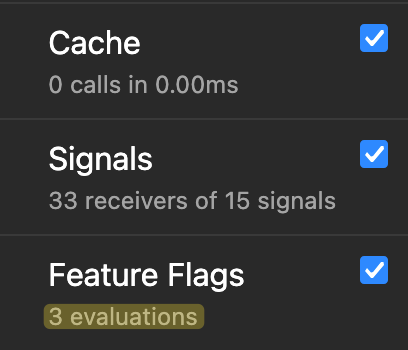

Cool!
# A note on thread safety
There's a subtle issue with the approach outlined in this post that's worth being aware of. Django's runserver handles concurrent requests in separate threads. When two requests overlap, both panel instances will have their _record() methods connected as signal receivers simultaneously. Since Django's signal dispatch is process-global, both receivers will fire for every feature_flag_evaluated signal sent — regardless of which request caused it. A concurrent request's feature flag evaluations could bleed into your panel.
This is a known gotcha with connecting per-request signal receivers. A potential fix is to use threading.local() to isolate recorded evaluations per thread. Django's own SQL panel sidesteps the problem entirely by attaching its logger directly to the database connection object, which Django already keeps thread-local.
That said, for a development-only debugging tool, this is pretty low stakes. Concurrent requests in runserver are possible but uncommon in day-to-day development, and if they do collide, the consequence is just some extra evaluations appearing in your panel, not data corruption or anything more sinister. The panel I built for my team doesn't account for this, and it hasn't caused any problems in practice, yet.
# Conclusion
We've just built a simple yet realistic custom DjDT panel. The feature flags panel that I actually built for my team is only marginally more complex than what I've shown here. In some ways, it's less complex! Yet it's still valuable enough to make our lives easier. Hopefully this has made you realise that you're sorely lacking a custom panel or two in your life. If you haven't, keep it in the back of your mind, and when you next find yourself neck-deep in logs with no answers, maybe you'll see the light! ✨